Sunday, February 24, 2013

Did CHK Counterfeit Marcellus Production Data?

I looked at CHK production data at Marcellus closer, and find more disturbing pattern which suggest that they may have pulled a DATA SCAM on the production of their Marcellus shale wells.


CHK had 321 Marcellus production in First half of 2012, By second half of 2012, 4 of the production wells were dropped and 94 new production wells were added.

The 4 wells dropped were:

015-20132, 015-20133, 015-21101, 015-21117

The 94 new wells added were:

007-20305,007-20344,015-20315,015-20375,015-20481,015-20495,015-20639,015-20665,
015-20705,015-20706,015-20873,015-20941,015-20951,015-20966,015-21044,015-21060,
015-21063,015-21121,015-21122,015-21139,015-21152,015-21159,015-21175,015-21214,
015-21240,015-21241,015-21243,015-21246,015-21290,015-21358,015-21370,015-21403,
015-21416,015-21429,015-21435,015-21511,015-21525,015-21528,015-21529,015-21601,
015-21602,015-21652,015-21677,015-21700,015-21759,015-21994,015-22026,015-22029,
113-20011,113-20019,015-21531,015-21535,015-21553,015-21555,015-21570,015-21571,
015-21572,015-21588,015-21591,015-21600,015-21604,015-21622,015-21654,015-21813,
015-21815,015-21827,015-21849,015-21850,015-21874,015-21924,015-21985,015-22003,
015-22020,015-22030,015-22072,015-22114,015-22115,015-22138,113-20004,113-20020,
113-20033,113-20110,113-20142,115-20507,115-20520,115-20605,115-20708,131-20033,
131-20037,131-20064,131-20104,131-20231,131-20232,131-20234

There were 317 wells that produced in both first half and second half of 2012. The top producing 62 wells shows little production decline, the combined daily production of these group actually INCREASDE by 7.7% from H1 to H2 of 2012, going from 365.3 MMCF/day to 393.4 MMCF/day, or 5.892MMCF/day to 6.346 MMCF/day on a average per well basis.

The remaining 255 wells produced a combined 998.65 MMCF/day in H1-2012 and dropped to 737.25 MMCF/day, or dropped -26.2%. This percentage drop is the NORMAL and expected percentagedrop in half a year, for the group of existing shale wells. On per well basis production dropped from 3.92 to 2.89 MMCF/day.

I believe that CHK either unintentionally messed up the data and reported them wrong, or they intentionally pulled a DATA SCAM on the reported production data on some of the most productive wells.

The 62 wells with questionally high productions which do not seem to drop much, are:

131-20062, 115-20256, 115-20269, 131-20058, 115-20257, 115-20268, 115-20324, 131-20169,
131-20121, 131-20125, 115-20296, 131-20138, 115-20458, 015-20673, 115-20279, 015-20242,
015-20600, 115-20271, 115-20393, 015-20701, 115-20341, 115-20325, 015-20452, 115-20351,
015-20458, 115-20244, 115-20272, 015-20488, 015-20482, 015-20645, 115-20303, 015-20997,
115-20243, 015-21224, 015-21521, 015-20644, 015-20457, 015-21302, 015-20403, 015-21293,
115-20498, 015-20646, 115-20426, 015-21980, 115-20424, 015-21979, 115-20593, 115-20592,
115-20105, 115-20442, 015-20124, 015-20234, 015-20625, 115-20073, 115-20068, 115-20182,
115-20108, 115-20066, 125-23943, 015-20410, 125-23944, 015-20425


Study the data and draw your own conclusion:
https://www.paoilandgasreporting.state.pa.us/publicreports/Modules/Production/ProductionHome.aspx


131-20062 1476659 179 8249 131-20062 1653825 183 9037 9.55%

115-20256 1459709 181 8065 115-20256 1634887 182 8983 11.39%
115-20269 1461695 182 8031 115-20269 1631246 184 8865 10.39%
131-20058 1440822 182 7917 131-20058 1604633 181 8865 11.98%
115-20257 1465199 181 8095 115-20257 1600436 184 8698 7.45%
115-20268 1402920 179 7838 115-20268 1576530 183 8615 9.92%
115-20324 1469184 182 8072 115-20324 1563409 184 8497 5.26%
131-20169 330849 57 5804 131-20169 1547512 183 8456 45.69%
131-20121 332043 57 5825 131-20121 1554890 184 8450 45.06%
131-20125 777646 135 5760 131-20125 1542115 183 8427 46.29%
115-20296 1416337 182 7782 115-20296 1524309 181 8422 8.22%
131-20138 770648 134 5751 131-20138 1437812 173 8311 44.51%
115-20458 1476401 182 8112 115-20458 1519707 183 8304 2.37%
015-20673 1441316 181 7963 015-20673 1508240 184 8197 2.94%
115-20279 1474577 182 8102 115-20279 1494398 183 8166 0.79%
015-20242 1429295 182 7853 015-20242 1413111 177 7984 1.66%
015-20600 1428242 182 7847 015-20600 1448489 183 7915 0.86%
115-20271 1477172 182 8116 115-20271 1454022 184 7902 -2.64%
115-20393 1472000 182 8088 115-20393 1434924 182 7884 -2.52%
015-20701 499066 81 6161 015-20701 1441815 184 7836 27.18%
115-20341 1479389 182 8129 115-20341 1407474 180 7819 -3.80%
115-20325 1469388 182 8074 115-20325 1427779 183 7802 -3.36%
015-20452 1044552 137 7624 015-20452 1432879 184 7787 2.14%
115-20351 1406359 182 7727 115-20351 1398467 181 7726 -0.01%
015-20458 1419562 181 7843 015-20458 1251273 162 7724 -1.52%
115-20244 1460883 182 8027 115-20244 1396425 182 7673 -4.41%
115-20272 1404935 182 7719 115-20272 1383846 183 7562 -2.04%
015-20488 1428338 182 7848 015-20488 1269073 168 7554 -3.75%
015-20482 1330503 164 8113 015-20482 1378817 183 7535 -7.13%
015-20645 472839 80 5910 015-20645 1376408 183 7521 27.25%
115-20303 1459934 182 8022 115-20303 1354704 181 7485 -6.70%
015-20997 355326 72 4935 015-20997 1359431 183 7429 50.53%
115-20243 1452286 182 7980 115-20243 1353519 184 7356 -7.81%
015-21224 1433244 182 7875 015-21224 1296706 179 7244 -8.01%
015-21521 98217 17 5777 015-21521 1314852 184 7146 23.69%
015-20644 489638 80 6120 015-20644 1287480 182 7074 15.58%
015-20457 1419537 182 7800 015-20457 1158702 164 7065 -9.42%
015-21302 388357 66 5884 015-21302 1291010 183 7055 19.89%
015-20403 1288945 177 7282 015-20403 1288649 184 7004 -3.83%
015-21293 546162 121 4514 015-21293 1137136 183 6214 37.67%
115-20498 383140 78 4912 115-20498 797474 129 6182 25.85%
015-20646 796271 135 5898 015-20646 1087595 182 5976 1.31%
115-20426 562665 102 5516 115-20426 1090302 183 5958 8.01%
015-21980 529852 90 5887 015-21980 1083175 183 5919 0.54%
115-20424 576143 101 5704 115-20424 1086960 184 5907 3.56%
015-21979 501435 91 5510 015-21979 998933 184 5429 -1.48%
115-20593 504734 102 4948 115-20593 967251 182 5315 7.40%
115-20592 454040 100 4540 115-20592 975384 184 5301 16.75%
115-20105 404616 127 3186 115-20105 890616 183 4867 52.76%
115-20442 314250 78 4029 115-20442 874448 184 4752 17.96%
015-20124 537558 182 2954 015-20124 493574 184 2682 -9.18%
015-20234 501389 181 2770 015-20234 480784 181 2656 -4.11%
015-20625 482920 181 2668 015-20625 436565 172 2538 -4.87%
115-20073 440528 182 2420 115-20073 428935 177 2423 0.12%
115-20068 403515 177 2280 115-20068 445109 184 2419 6.11%
115-20182 280366 177 1584 115-20182 322340 184 1752 10.60%
115-20108 331008 182 1819 115-20108 322502 184 1753 -3.63%
115-20066 281002 182 1544 115-20066 271904 179 1519 -1.62%
125-23943 224515 182 1234 125-23943 241290 184 1311 6.30%
015-20410 207206 182 1138 015-20410 194015 178 1090 -4.26%
125-23944 180793 182 993 125-23944 194181 184 1055 6.24%
015-20425 204524 182 1124 015-20425 191805 184 1042 -7.24%

Explanation of the data above, with the first row as an example:

131-20062 1476659 179 8249 131-20062 1653825 183 9037 9.55%


131-20062  is well number
1476659  is H1 2012 production in MCF (thousand cubic feet)
179         is days of production in H1 2012.
8249       is calculated average per day (=1476659/179)
131-20062 is well number again
1653825 is H2 2012 production in MCF (thousand cubic feet)

183         is days of production in H1 2012.
9037       is calculated average per day (=1476659/179)
9.55%    is percentage change of daily production, from H1 to H2.

Friday, February 22, 2013

The Marcellus Shale Production Update

The PA DEP finally released Marcellus shale production data for second half of 2012. It shows significant production growth from the first half to second half. So I want to study the data closer to get an idea what's going on.

Looking at the data I note the following summary:

  • In H1-2012, there were 2835 wells produced a total of 895.555 BCF of shale gas in 442194 well production days. That figures to an averages of 4.92 BCF/day total production, and an average of 2.0246 MMCF/day per well.
  • In H2-2012, there were 3551 wells produced a total of 1146.8 BCF of shale gas in 558212 well production days. The average is 6.233 BCF/day total production, 2054.4 MCF/day per well.
There are two surprises to me. One is the data suggests that there seems to be 716 new wells added in H2-2012, averaging 3.9 new wells per day. I knew from my previous study that 4 wells per day in average is needed to maintain flat Marcellus production, and the well spud rate dropped to roughly 2.5 new wells per day starting in July 2012. Obviously the drop of spud rate has not translated into the drop of well completion rate so far yet. It will take a bit more time for the slow down of well drilling to lead to slow down in well completion.

Another surprise to me is that the data seems to suggest that production from existing wells some how are not dropping as fast as I believe they should. Thus I looked at the data closer.

I screwinized the production data and removed a few wells that were producing in H1-2012 but not in H2-2012, as they may distort the data. The remaining wells are in two categories:

  • Existing wells that produced in both H1 and H2 of 2012. There are 2823 of them. They produced 892.7364 BCF in H1 in 436366 well production days. They averaged 4.905 BCF/day in total production and 2045.843 MCF/day per well. The average days of production is 154.6 days in the 182 days H1 period.
  • These same 2823 existing wells produced 881.8125 BCF in H2 in 490046 well production days. That averages 4.79 BCF/day in total production, and 1799.45 MCF/day per well. The average days of production is 173.6 days, in the 184 days H2 period.
  • There are 727 new wells in H2-2012. They produced 264.9895 BCF in 68165 well production days, averaging 1.44 BCF/day in total production and 3887.5 MCF/day per well. The average days of production of these wells is 93.8 days in H2-2012.

The data suggests that productivity of existing wells declined from 2045.843 MMCF/day to 1799.45 MCF/day in 182 days. The average decline is losing -0.07%/day. That's a far slower decline than my previous rule of thumb of losing -0.2%/day. What's going on? I will come back to look at this decline closer.

If existing production rate of 5 BCF/day is losing 0.07% per day. That's losing 3.5 MMCF/day. Since each new well averaged 3.8875 MMCF/day, the data suggests that 0.9 new wells per day is the threshold needed to maintain flat production. My previous estimate was 4 new wells per day.

Why the existing wells are declining at only -0.07%/day?

I examined the individual wells closer.

I find that MOST of wells indeed decline much faster than that. For example well 005-30503 declined 25% from H1 to H2. Well 015-20258 declined 43%!!! Well 015-20262 declined 40%!!!

Nowever there are SOME exceptionally good wells from the seeming sweet spots. These wells have extremely high production rates, and they don't seem to decline much so far.

For example well 015-20444 and 015-20488. The well 015-20488 produced at 7.848 MMCF/day in H1 and 7.554 MMCF/day in H2. That's hardly a decline of -3.75% in half a year. That well, owned by CHK, has produced 6.64 BCF so far. It has no sign of slowing down any time soon. That is really an amazingly high production well.

Are these exceptionally good sweet spot wells the exception, or the norm? I do not know. I have to scrutinize the data further.

But for H1 to H2 of 2012, lack of decline of existing wells supported the total production and pushed it higher. This trend may continue for Marcellus for a little while longer.

But at least by now I know the EIA data on Marcellus production is off. According to EIA, who ontained the data from Bentek, the Marcellus production averaged 6.873 BCF in H2-2012.

The PA DEP data, as discussed above, indicated an average production of 6.233 BCF/day in H2-2012. So the EIA data was off by 0.64 BCF.day. That is a pretty significant discrepancy.

[UPDATE]

I noticed one curious and interesting FACT.


When looking at the wells individually, most of wells decline at rates where I expect them to be, losing 25% to 30% in half a year.


However for those few wells that are exceptionally highly production, and also declines at incredibly low rate, there is NO EXCEPTION. Each and every one of such wells belongs to CHK. I have not find one such high productive and low decline well belong to another company.

Here are just some of the well numbers

131-20062
115-20341
115-20271
015-20482
115-20458
115-20279
115-20257
115-20393
115-20325
115-20324
115-20256
115-20269
115-20244
115-20303
115-20243
015-20673
131-20058
015-20471
015-21224
015-20242
015-20445
015-20488
015-20600
015-20458
115-20268
015-20457
115-20296
115-20351
115-20272
015-20866
015-20452
015-21656
015-20403
015-21655
015-20991
115-20212
015-21609
015-20646
015-20423
115-20424


Very interesting.


Is CHK, Chesapeake Energy, pulling a DATA SCAM on the records?


I don't know how they are going to explain who they have such high production wells that simply will not decline like most shale wells do.

Friday, February 8, 2013

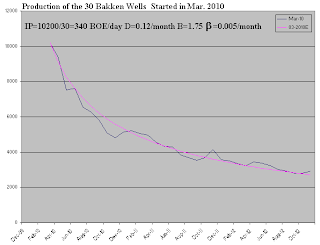
The Real Bakken Shale Oil Well Declines

I am about done with analyzing the real production data from Bakken shale oil wells. I am posting the charts I obtained:


The above are well decline history of all Bakken shale wells that has been producing continuously.

The following shows the decline characteristics of Bakken wells started at different times:


In summary, the existing Bakken shale wells are collectively declining -0.2% per day. That's losing slightly more than HALF of production rate in one year.

The EIA Joked on Natural Gas Production Data

Here is a definite proof that the monthly natural gas production data published by EIA is nothing but a JOKE. They have almost zero credibility.


To start, go to EIA wek site and find the Weekly Natural Gas Update. At the bottom they have a chart showing productions from all shale plays. Below the chart there is a link allowing you to download the raw data used to create the chart.


Do you notice something odd? Despite of massive drilling rig drop, and a lot less wells drilled, and despite of the fact that shale wells decline fast, as shown by EIA, the Marcellus production sems to defy gravity and continue to grow up without any slowing. How could it be possible.


I extracted the Marcellus part of the data, it looks to me like a complete joke. Let me paste all the Marcellus data here, so you can judge whether this is ridiculous or not:


Dry shale gas production (Billion cubic feet per day)

Marcellus (PA and WV)

1/1/2007 0.020414941
2/1/2007 0.021928615
3/1/2007 0.023202324
4/1/2007 0.023539191
5/1/2007 0.024270666
6/1/2007 0.025593099
7/1/2007 0.026332206
8/1/2007 0.025327993
9/1/2007 0.028556724
10/1/2007 0.031472248
11/1/2007 0.034466894
12/1/2007 0.036114525
1/1/2008 0.036439162
2/1/2008 0.057211911
3/1/2008 0.076914715
4/1/2008 0.089541419
5/1/2008 0.109314548
6/1/2008 0.117205475
7/1/2008 0.136433165
8/1/2008 0.139649025
9/1/2008 0.139340395
10/1/2008 0.148172389
11/1/2008 0.148962162
12/1/2008 0.155200095
1/1/2009 0.134042178
2/1/2009 0.091690035
3/1/2009 0.107014843
4/1/2009 0.111614036
5/1/2009 0.117017073
6/1/2009 0.11661637
7/1/2009 0.118719651
8/1/2009 0.128221411
9/1/2009 0.137161605
10/1/2009 0.141329818
11/1/2009 0.140823304
12/1/2009 0.127659797
1/1/2010 0.481882287
2/1/2010 0.637744188
3/1/2010 0.798307082
4/1/2010 0.868073158
5/1/2010 1.017980024
6/1/2010 1.276166703
7/1/2010 1.269514246
8/1/2010 1.42571918
9/1/2010 1.647672123
10/1/2010 1.821883771
11/1/2010 2.047449075
12/1/2010 2.082841924
1/1/2011 2.366314737
2/1/2011 2.526894717
3/1/2011 2.773444294
4/1/2011 3.012380529
5/1/2011 3.057075584
6/1/2011 3.057975032
7/1/2011 3.544594619
8/1/2011 3.568587512
9/1/2011 3.762196787
10/1/2011 3.949613152
11/1/2011 4.405352219
12/1/2011 4.793736336
1/1/2012 5.164640947
2/1/2012 5.478762587
3/1/2012 5.61576504
4/1/2012 5.639587719
5/1/2012 5.991993065
6/1/2012 6.262796758
7/1/2012 6.290871349
8/1/2012 6.555845752
9/1/2012 6.714694689
10/1/2012 6.984281178
11/1/2012 7.257084169
12/1/2012 7.437482985


It can be seen much clearer, if you plot the data into a chart. The chart basically is composed of two straight lines. One straight line is from Jan. 1 of 2007 to Dec. 31 of 2009. It was flat, very low production and virtually no growth. It took three years and production grew from 0.02 BCF/day to 0.128 BCF/day. Effectively no growth.


And then magic happened in Jan. 2010. The production suddenly jumped from 0.128 BCF/day to 0.482 BCF/day. And from then on it was no stop, constant growth at a uniform rapid pace.


From Dec 31, 2009 up to Dec. 31, 2012, latest data available, the Marcellus production was basically a STRAIGHT LINE, going from 0.2 to 7.4 BCF/day in a straight fashion, adding exactly 0.2 BCF/day production rate each month. The growth was so uniform and so linear, it looks like rig count, well count, well declines, production rate change are all irrelevant and all had NO IMPACT on the production. It was just a straight line.


What a joke! EIA has lost all credibility in its data modeling!!! They even pretend it was actual production data. No, it was NOT actual production data. Actually None of the Marcellus producers has reported any H2 2012 production figure to any state government agency, except that they reported the production total in the Q3 quarterly report. The quarterly reports contradict EIA data, BTW.


How Fast Does Bakken Shale Oil Wells Decline

Arthur Berman is not the only shale gas skeptism. I am probably the most outspoken critic Shale Gas among all people who wrote on Seeking Alpha. They have now imposed worse censorship on me because I spoke out on the truth of shale gas. Not only they banned me from writting any article or instablog on Seeking Alpha. They banned me from making any comment or even communicate privately with any Seeking Alpha readers. In communist countries at least people are free to communicate privately.


This tells you that they feared people to hear the truth on shale gas. I intend to complaint to SEC about Seeking Alpha's blatant market manipulation by supressing truthful information. Some vested interest group played a dirty hand in getting me, Mark Anthony, completely banned on Seeking Alpha. My previous articles are still there. But I bet they will ultimately remove all traces of them eventually.


Now, Arthur Berman first got my attention to the potential scam in the US shale gas industry. But unlike most people, I do not take Arthur Berman's words on face value. I dig out data myself and do my own data analysis.


Here is what I find out by studying data from several thousand Bakken wells. Bakken is a good study candicate thanks for excellent public data release by North Dakota Department of Mineral Resources. They have month by month production statistics of ALL Bakken shale wells. So you can track each well and see how the production declines.


My study shows that Bakken well declines MUCH FASTER than even Arthur Berman claimed. For example I summed up production from 3062 Bakken wells that has been continuously producing in all the months from May to Nov 2012, including 128 wells that only started in May 2012. That's the entirety of all wells I can find that has been producing continuously, but excluding a few that produced for a while and then shut down.


In May 2012, those existing wells produced at average of 506869 Barrels per day (BOE), with gas and oil production lumped together as Barrel of Oil Equivalence (BOE).


In Nov 2012, only six months later, these same 3062 wells produced at 353040 BOE/day. That's a drop of -30.35% in merely six months. That's averaging at -0.2% drop per day, or -5.9% drop per month, or -51.5% drop per year.


That's how fast the collective group of existing wells drop, with newest and oldest wells all included. That's losing slightly more than half of production rate in a year.


Identifying only the newest 128 wells which only started in May 2012. These 128 wells dropped from 62067.67 BOE/day to 27950.77 BOE/day, or losing -55.0% in six months. That's a -0.436% drop per day, or -12.5% loss per month, or losing 80% in a year. Here are just some of the well numbers in this group:


21104,21088,21324,21796,18797,20170,20421,21399,

21400,21582,21434,21587,21588,19416,19265,18939,

21662,21627,20617,21640,21730,21731,21477,19456


Now looking at the oldest wells within this group. There are 1244 Bakken wells that has been producing continuously since Dec., 2009. These wells produced at 111911 BOE/day in Dec. 2009. They dropped to 54539 BOE/day in May 2012 and further dropped to 50234 BOE/day in Nov 2012. So these vintage wells more than three years old were dropping at -7.9% every half year, or losing -15.2% per year. These wells show that even after more than three years, the well decline is still very steep.


Singling out wells first started in Jan. 2010, no early and no later. There are 31 of them:

17181,18141,17880,16323,16568,18193,17625,18023,

18138,9253,7503,18115,17943,18260,18134,18223,

17026,18061,17478,18230,17502,16877,18077,18109,

9108,18163,17910,18251,18135,18172,17764


These wells that started in Jan 2010 produced at 8052.68 BOE/day in that month, dropped to 2433.77 BOE in May 2012 and then to 2007.77 in Dec. 2012. So these three year old wells dropped at losing -17.5% in half a year, or losing -32% per year, or losing 0.1% per day.


At such steep decline, even Bakken shale, perceived as most profitable due to its high content of oil and high oil price, is NOT profitable currently. They need $20 or $30/barrel higher oil price to break even.


The US shale gas industry has created a Ponzi Scheme from over a trillion dollars of investor money. This is a bubble that will burst soon. What do they get after spending over a trillion dollars and accumulated half a trillion dollars of debts? They drilled roughly 36000 shale wells and produced roughly 23 TCF of shale gas. And they are left with shale wells that produce gas at 27 BCF/day and decline at roughly losing -0.2% per day.   If they stop spending money and stop bringing any new wells onto production, the existing wells, producing at 27 BCF/day and continue to decline at losing 0.2% per day, will produce another 13.5 TCF of gas before they are exhausted.   So that means the entire shale gas adventure so far, which counted the industry one trillion dollars, brings in 23 TCF pas production and 13.5 TCF future production, total 36.5 TCF of gas. At today's gas price of roughly $3.5/mmBtu that would be worth $128B of revenue. The shale gas industry is losing their collective arses and their collective minds.